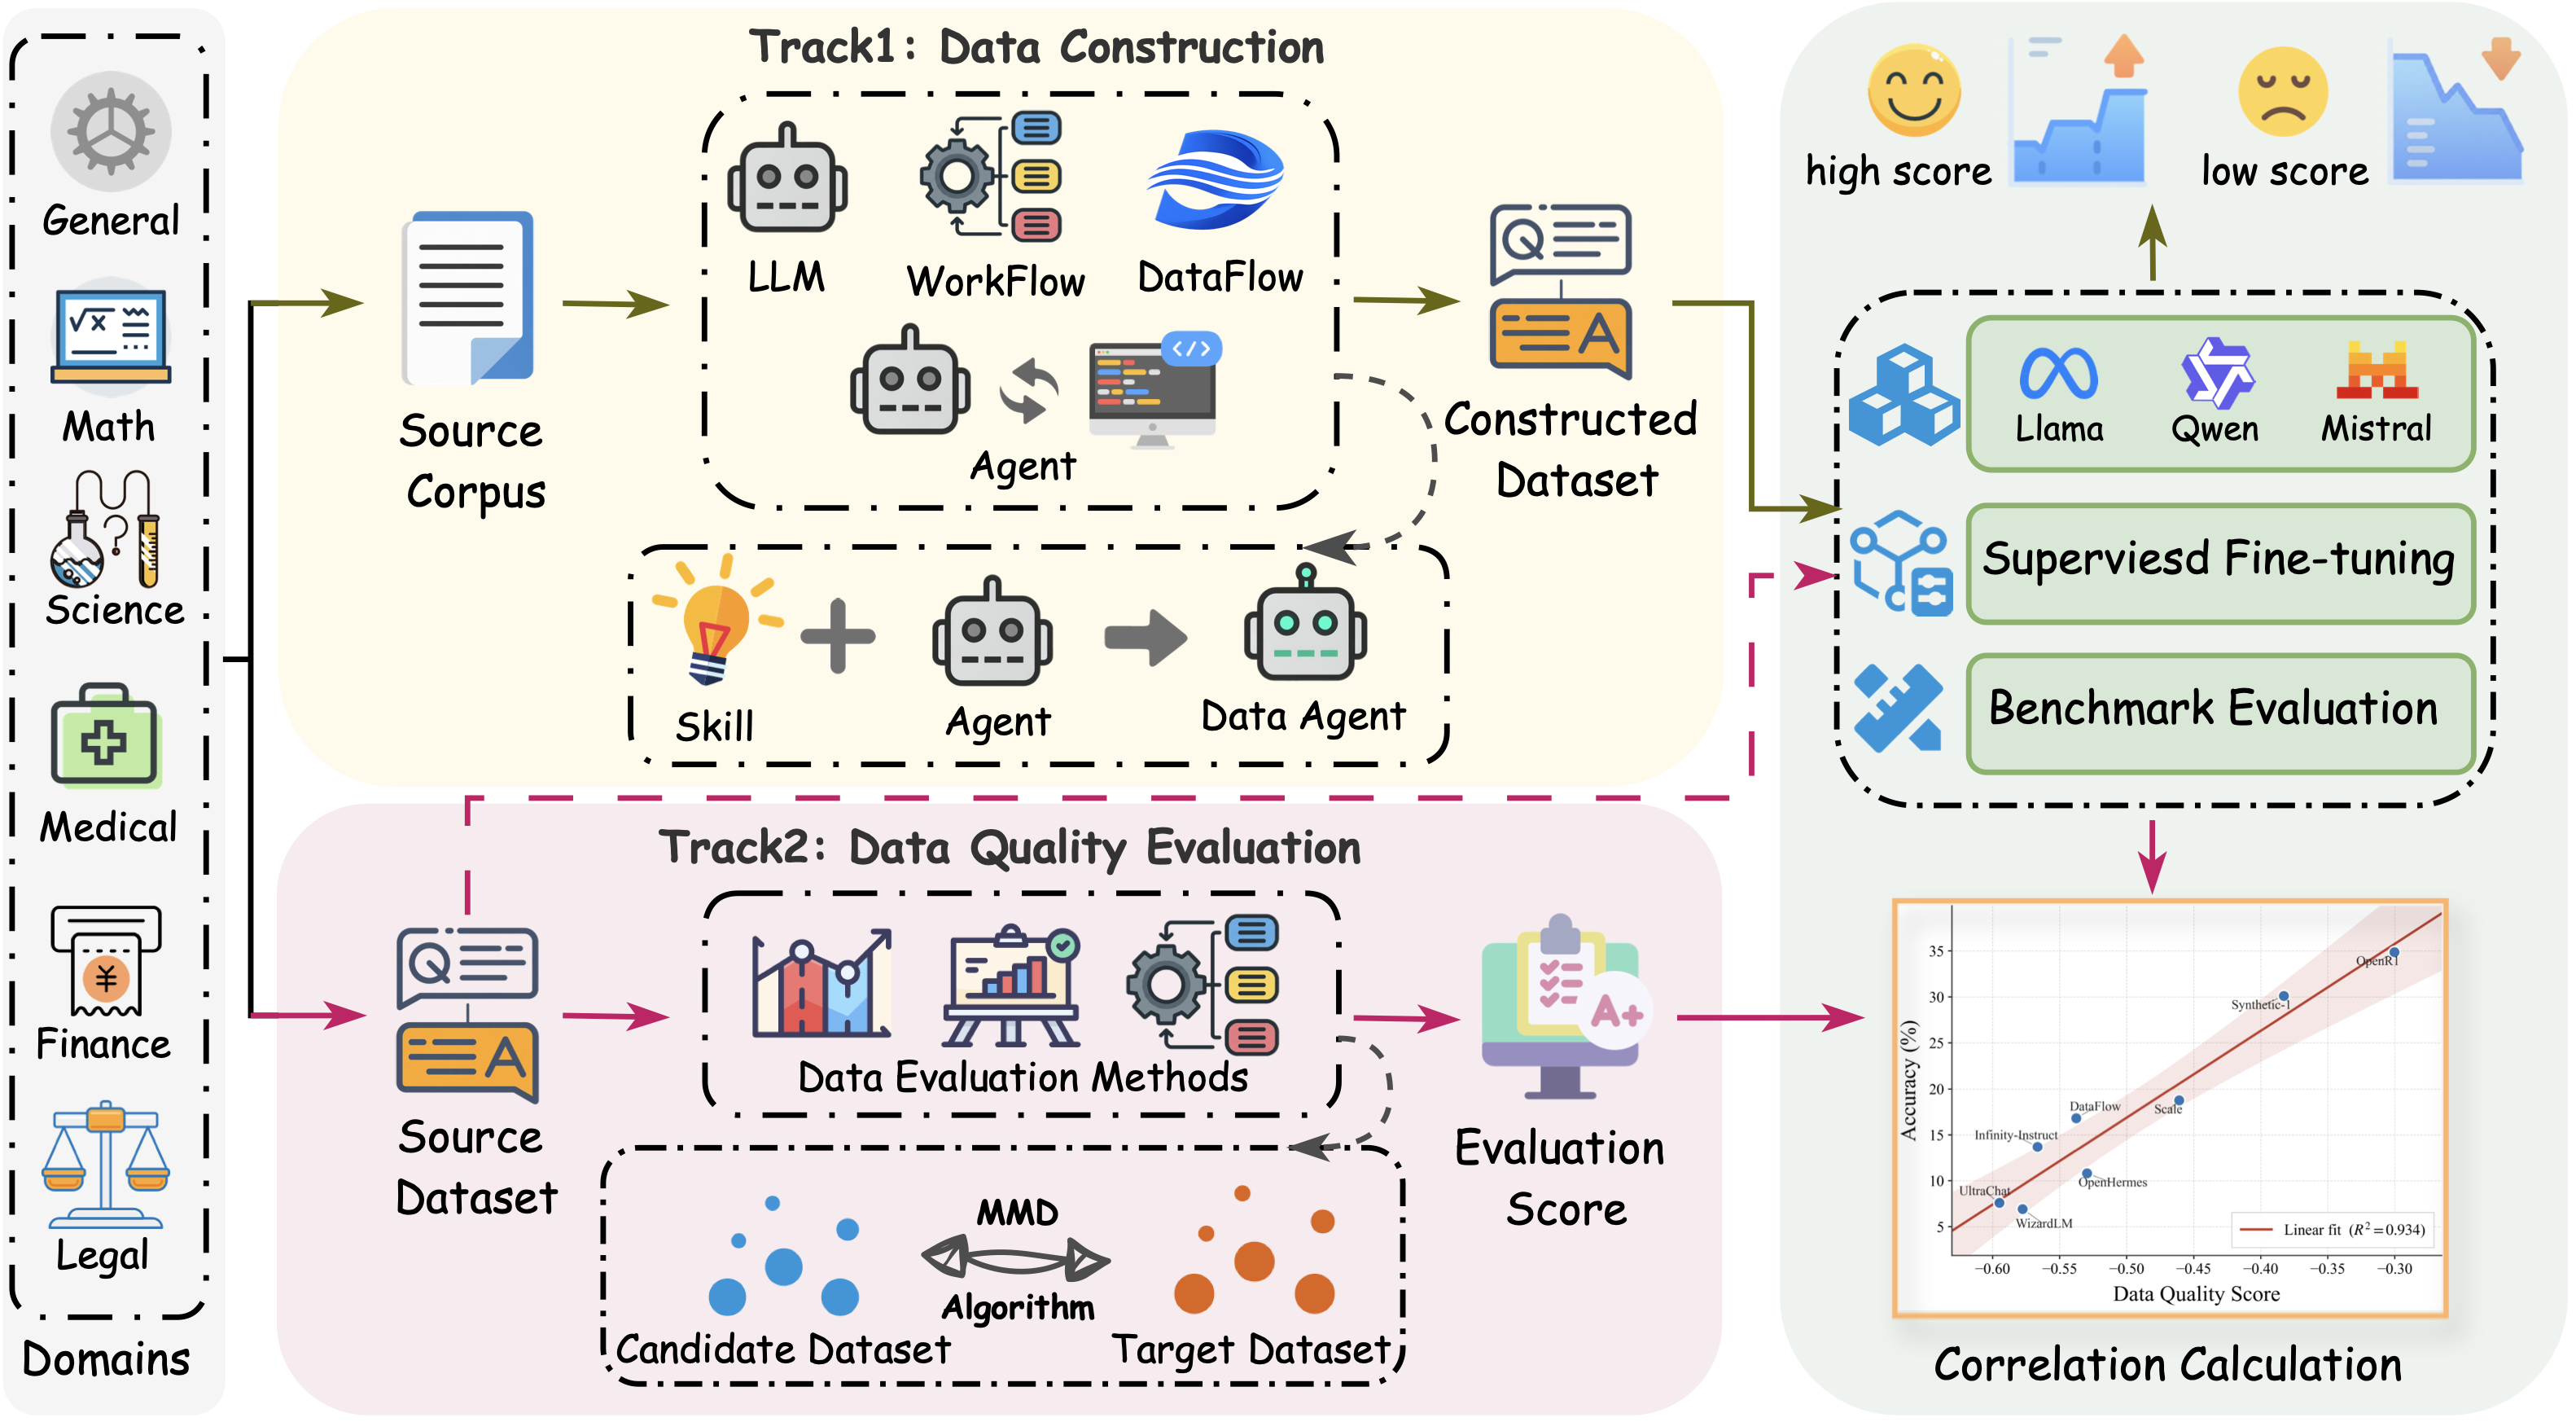
A Unified Benchmark for LLM-Driven Training Data Preparation

DataPrep-Bench:
Benchmarking LLMs as Training Data Preparators

Peking University  ·  Institute for Advanced Algorithms Research, Shanghai  ·  OriginHub Technology  ·  Zhongguancun Academy
* Equal Contribution  ·   Project Leader  ·   Corresponding Author (wentao.zhang@pku.edu.cn)

DataPrep-Bench is the first unified, downstream-grounded benchmark that jointly evaluates how well LLMs, agents, and data workflows can prepare training data end to end. It covers two complementary tracks: Data Construction, which transforms raw sources into SFT data, and Data Quality Evaluation, which predicts the downstream utility of candidate datasets. It also ships two strong baselines: Data-Construction-Skill for skill-driven agentic construction and the Distributional Alignment Score (DAS), a training-free, MMD-based quality estimator.

01Abstract

The quality of training data fundamentally determines the capabilities of large language models (LLMs). As the community increasingly relies on LLMs, agents, and data-centric workflows to produce and curate training corpora, a foundational question emerges: how well can these systems actually prepare training data end to end? Despite the rapid proliferation of LLM-driven data preparation techniques, no unified benchmark exists to systematically measure their effectiveness.

We view LLM-driven data preparation as comprising two complementary capabilities: data construction, which transforms raw sources into high-quality training data, and data quality evaluation, which predicts the training value of candidate datasets before downstream training. We introduce DataPrep-Bench, the first comprehensive benchmark that jointly evaluates both capabilities as first-class targets under a unified, downstream-grounded protocol.

DataPrep-Bench is organized around two tracks. (1) Data Construction takes low-quality or otherwise non-trainable sources (e.g., domain books) as input and asks agents or workflows to transform them into supervised training data; the produced data is evaluated end to end by the downstream performance of models fine-tuned on it. We release Data-Construction-Skill as a strong baseline. (2) Data Quality Evaluation takes mainstream candidate training datasets and produces scalar scores; its goal is to measure whether a scoring function is linearly predictive of downstream utility. We release the Distributional Alignment Score (DAS) as a strong baseline. Across multiple domains and architectures, DAS achieves strong overall correlation with downstream performance and outperforms existing quality-, diversity-, and heuristic-based evaluators in most settings.

02Framework Overview

DataPrep-Bench evaluates LLM-driven data preparation: the use of LLMs, agents, and data workflows to produce or assess training data. It covers two capabilities: Data Construction, which turns raw domain sources into supervised training data, and Data Quality Evaluation, which predicts which candidate datasets are likely to improve downstream models before training. Both tracks are tested under shared domains, base models, training protocols, and downstream benchmarks, so methods are compared by their actual downstream impact.

Domains
Math
Science
Medical
Finance
Law
General Text
Overall framework of DataPrep-Bench
The overall framework of DataPrep-Bench.

03Two Evaluation Tracks

Both tracks ask the same practical question: does a data preparation decision lead to a better downstream model? They differ in where the decision happens. One track evaluates methods that create training data from raw sources; the other evaluates metrics that score existing candidate datasets before training.

Track 1

Data Construction

Can a method turn raw domain materials into useful supervised fine-tuning data?

Input

Domain books, manuals, and long-form knowledge sources converted into a shared Markdown format.

Method Output

A supervised question-answer dataset synthesized from those raw sources.

Judgment

Fine-tune the same base model with the constructed data plus Dolly-15k, then evaluate on held-out domain benchmarks.

Released Baseline

Data-Construction-Skill, a skill-guided agent with reusable schemas, filtering rules, coverage checks, and validation utilities.

Track 2

Data Quality Evaluation

Can a metric predict which candidate datasets will improve downstream performance before fine-tuning?

Input

Public SFT candidate pools for each domain, mixing in-domain and out-of-domain datasets, with optional domain proxies.

Metric Output

One utility score for each candidate dataset, computed before any downstream training is run.

Judgment

Compare the metric scores against released ground-truth performance records from models fine-tuned on the same candidates.

Released Baseline

Distributional Alignment Score (DAS), a training-free metric that measures how closely a candidate matches a domain proxy.

04Strong Baselines

For Track 1 · Data Construction

Data-Construction-Skill

A skill-guided agentic method for turning long-form domain documents into reusable QA-style SFT data. It is designed for corpus-scale construction, where a single prompt is not enough to manage decomposition, consistency, coverage, validation, and resumable execution.

Core idea

The agent still plans over the corpus and executes the construction work, but the reusable skill layer defines what counts as valid supervision. The skill packages task instructions, output schemas, sample-type definitions, filtering rules, coverage requirements, and validation utilities into a structured interface for the agent.

This makes the method more than a one-off QA-generation prompt: it is a controllable framework for extracting, reformulating, checking, and tracking supervision across hundreds of pages of expert-authored content.

What the skill controls
  • Which chunks contain reusable domain knowledge
  • Which sample types are valid for each chunk
  • Whether questions are faithful and self-contained
  • Which malformed, duplicated, or hallucinated samples are rejected
  • How coverage and resumability are recorded
Construction pipeline
1
Chunk long documents
Split books and manuals into semantically coherent chunks that are small enough for agent processing but still locally complete.
2
Triage reusable knowledge
Keep chunks that teach definitions, rules, mechanisms, conditions, exceptions, comparisons, or causal links; skip noisy or navigational content.
3
Generate three QA forms
Create concept QA, source-grounded reasoning QA, and simple case-application QA when the chunk supports them.
4
Validate and track coverage
Remove document-relative phrasing and weak samples, then maintain chunk-level records for coverage checking and resumable runs.
Why it matters: Data-Construction-Skill preserves the flexibility of agentic planning while using explicit skill-level constraints to stabilize quality, coverage, and faithfulness across long-form corpora.
For Track 2 · Data Quality Evaluation

Distributional Alignment Score (DAS)

A training-free metric for estimating whether a candidate SFT dataset is likely to help a target domain. DAS scores a candidate by measuring how closely its text distribution aligns with a domain proxy dataset.

Core idea

If a candidate dataset is distributionally close to a high-quality proxy for the target domain, it is more likely to provide useful training signal for that domain. DAS turns this intuition into a plug-in score by embedding both the candidate and the proxy with the same fixed text encoder, then measuring their distributional distance with MMD.

We use a proxy rather than the benchmark test set itself, so the metric can estimate target-domain proximity without leaking test data into dataset selection. Higher DAS means smaller proxy distance and stronger predicted downstream utility.

What DAS is testing
  • Can a metric rank datasets before fine-tuning?
  • Does domain alignment predict downstream utility?
  • Can we avoid benchmark contamination by using proxies?
  • Do metric scores correlate with released ground-truth performance records?
Scoring pipeline
1
Encode
Represent samples from the candidate dataset and the domain proxy with the same fixed text encoder for comparability.
2
Measure alignment
Compute MMD between the candidate and proxy feature distributions using a Gaussian RBF kernel.
3
Score utility
Return a higher score for candidates with smaller proxy distance, then test whether those scores predict real downstream performance.
Domain proxy datasets used by DAS
General: Infinity-Instruct Math: ODA-Math-460k Science: Logics-STEM Medical: ReasonMed Finance: Fin-o1 Law: DISC-Law-SFT
Why it matters: DAS is grounded in domain-adaptation intuition: under a fixed model family and training protocol, better alignment between training data and the target domain should reduce target-side risk. The proxy formulation makes this usable without touching benchmark test data.

05Benchmarks & Experimental Setup

The experiments instantiate the two-track benchmark under fixed resources and protocols. In Track 1, every construction method consumes the same raw sources and is judged by the downstream performance of models trained on its synthesized data. In Track 2, every quality metric scores the same candidate datasets and is judged by how well those scores predict the released ground-truth downstream performance records.

A data preparation decision is evaluated only through downstream model behavior: either by training on the produced data, or by testing whether a metric predicts the performance of training on candidate data.
Track 1 · Data Construction

Same raw sources, downstream judgment

DataFlow workflows, direct LLM generation, ReAct-style agents, and Data-Construction-Skill all consume the same domain source corpus and output synthesized SFT data.

  • Sources: domain books and long-form materials converted to Markdown with MinerU; General Text uses a 150 MB FineWeb sample.
  • Training: each synthesized dataset is mixed with Dolly-15k; the reference baseline uses Dolly-15k alone.
  • Models: Qwen2.5-7B and Llama-3.1-8B are fine-tuned with the same LlamaFactory recipe.
Track 2 · Data Quality Evaluation

Same candidate pools, predictive judgment

DAS and 17 DataFlow quality/diversity evaluators score the same public SFT candidate pools before downstream training.

  • Candidates: each domain mixes in-domain and out-of-domain public SFT datasets.
  • Ground truth: every candidate is actually fine-tuned and evaluated to obtain downstream utility.
  • Models: Qwen2.5-7B, Llama-3.1-8B, and Mistral-7B-v0.3 test whether metric correlations are model-dependent.
Shared domains and target benchmarks
General: MMLU-Redux Math: AIME24, AMC23, Gaokao2024, GSM8K, MATH, MinervaMath, OlympiadBench Science: MMLU-STEM, MMLU-Pro, GPQA, SuperGPQA, ChemBench, PIQA, SciBench Medical: MedR-Bench, MedMCQA, MedCaseReasoning Finance: XFinBench, FinEval-KR, CPA-KQA Law: LegalBench, LexGLUE

06Track 1 · Data Construction Results

Track 1 asks whether synthesized domain data actually helps after fine-tuning. We compare DataFlow workflows, direct LLM generation, ReAct-style agents, and our skill-guided agent baseline. Each method receives the same raw source corpus; its output is mixed with Dolly-15k, used to fine-tune Qwen2.5-7B or Llama-3.1-8B, and evaluated on held-out benchmarks across six domains.

What Qwen2.5-7B shows
  • No method family dominates. On Qwen2.5-7B, agents achieve the strongest averages in Math and Medical, DataFlow is strongest in Law, and different methods win different sub-benchmarks.
  • Skill is competitive but not universal. It ties for best on General Text (78.2), is best on Minerva-Math (14.0), and stays near the top on Math Avg (24.1).
  • Synthetic data is not automatically beneficial. The no-synthetic Dolly-only baseline remains strong in several domains, especially Science (27.9 Avg).
  • Finance and Medicine reward different construction behavior. DataFlow-Skill is strongest on Finance (64.8), while Gemini agent is strongest on Medicine (43.8).
Table A. Qwen2.5-7B — Math, General, and Finance
Generator Math General Finance
GSM8K AMC23 AIME24 M-Math OB M500 GK24 Avg MMLU-R Avg CPA-KQA FinEval-KR XFinBench Avg
No synthetic training 69.917.50.010.710.739.816.523.6 77.777.7 57.659.456.357.8
DataFlow-based Generators
DataFlow56.57.50.07.77.927.417.617.877.977.951.054.559.354.9
DataFlow-Skill56.710.00.08.86.222.828.619.076.576.560.065.468.964.8
LLM-based Generators
Claude Opus 4.668.812.50.08.89.835.514.321.478.278.237.639.655.944.4
Gemini 3.0 Pro72.120.00.010.711.437.915.423.977.877.848.649.558.452.2
GPT-5.266.717.50.07.711.132.714.321.477.977.947.143.653.648.1
Agent-based Generators
Qwen3.5-Plus72.722.53.311.011.638.716.525.277.677.648.149.555.651.1
GLM-4.771.422.53.39.611.637.920.925.377.377.351.455.453.153.3
Claude Opus 4.669.410.00.011.08.933.819.821.875.975.932.439.653.841.9
Gemini 3.0 Pro70.115.00.08.810.835.720.923.077.777.753.352.555.453.7
GPT-5.269.625.03.38.89.935.626.425.577.777.739.139.651.043.2
GPT-5.3-codex70.815.00.011.011.738.513.222.977.677.658.663.455.959.3
Skill (Claude Opus 4.6) 72.617.53.314.011.136.813.224.1 78.278.2 57.653.555.455.5
Abbreviations: M-Math = Minerva-Math · OB = OlympiadBench · M500 = MATH-500 · GK24 = Gaokao 2024 · MMLU-R = MMLU-Redux · CPA-KQA = CPA-KQA · FEKR = FinEval-KR · XFB = XFinBench. Source: Table synthetic_data_mgf_qwen in the paper. Bold marks the best in each column.
Table B. Qwen2.5-7B — Law, Medical, and Science
Generator Law Medical Science
LegalBench LexGLUE Avg MedCaseR. MedMCQA MedR-Bench Avg MMLU-STEM MMLU-Pro GPQA SuperGPQA ChemBench PIQA SciBench Avg
No synthetic training 86.962.074.5 13.627.467.836.3 47.528.621.115.724.352.75.227.9
DataFlow-based Generators
DataFlow89.764.877.29.929.463.634.337.923.920.711.815.728.82.020.1
DataFlow-Skill92.057.474.711.924.165.633.944.224.618.013.018.843.52.023.4
LLM-based Generators
Claude Opus 4.688.063.275.613.98.166.829.638.724.622.413.119.340.92.723.1
Gemini 3.0 Pro85.963.574.712.26.069.129.139.725.719.712.721.244.03.323.8
GPT-5.289.260.975.010.623.366.033.338.324.622.912.817.938.12.022.4
Agent-based Generators
Qwen3.5-Plus90.261.075.616.516.568.333.847.526.921.714.822.948.65.326.8
GLM-4.784.861.473.115.210.666.830.942.025.718.912.719.443.62.323.5
Claude Opus 4.665.248.857.016.650.754.340.536.624.119.012.919.244.12.222.6
Gemini 3.0 Pro57.555.556.515.852.363.443.846.027.622.414.720.350.02.526.2
GPT-5.261.751.956.814.745.059.039.644.025.321.114.020.246.42.824.8
GPT-5.3-codex87.863.475.613.620.370.034.635.922.416.411.216.533.13.419.8
Skill (Claude Opus 4.6) 85.561.773.6 9.915.365.430.2 39.822.819.212.217.136.91.721.4
Abbreviations: MCR = MedCaseReasoning · MMCQA = MedMCQA · MRB = MedR-Bench · MSTEM = MMLU-STEM · MPRO = MMLU-Pro · SGPQA = SuperGPQA · CB = ChemBench · SB = SciBench. Source: Table synthetic_data_slm_qwen in the paper.
What Llama-3.1-8B shows
  • The clearest positive signal is Finance. DataFlow-Skill reaches 36.5 and Data-Construction-Skill reaches 34.2, both substantially above the Dolly-only baseline of 15.1.
  • Medicine also benefits from constructed data. Claude Opus direct generation reaches 36.1, and Skill is close at 35.4.
  • Science is a counterexample to simple scaling. The Dolly-only baseline is best at 13.2, and most generated datasets reduce performance.
  • Math and General Text are also fragile. Many generators underperform the no-synthetic baseline, showing why the benchmark must measure downstream utility rather than dataset appearance.
Table C. Llama-3.1-8B — Math, General, and Finance
Generator Math General Finance
GSM8K AMC23 AIME24 M-Math OB M500 GK24 Avg MMLU-R Avg CPA-KQA FinEval-KR XFinBench Avg
No synthetic training 33.910.00.06.63.713.614.311.7 67.167.1 12.612.420.315.1
DataFlow-based Generators
DataFlow8.410.00.04.82.56.18.85.851.151.127.126.740.531.4
DataFlow-Skill8.72.50.04.43.37.216.56.148.448.434.831.743.036.5
LLM-based Generators
Claude Opus 4.628.75.00.06.22.811.211.09.352.952.922.924.837.528.4
Gemini 3.0 Pro30.77.50.08.13.712.614.311.050.850.823.827.742.131.2
GPT-5.226.82.50.07.74.110.213.29.247.447.425.224.832.227.4
Agent-based Generators
Qwen3.5-Plus33.75.00.06.64.411.312.110.450.450.423.320.838.227.4
GLM-4.731.82.50.05.93.113.017.610.649.249.223.825.743.030.8
Claude Opus 4.616.45.00.06.62.57.78.86.747.547.523.325.737.728.9
Gemini 3.0 Pro29.67.50.06.23.611.517.610.947.947.925.221.840.929.3
GPT-5.228.75.00.06.64.010.415.410.049.049.021.921.844.829.5
GPT-5.3-codex29.92.50.05.92.812.214.39.751.351.323.325.741.830.3
Skill (Claude Opus 4.6) 16.57.50.04.43.09.511.07.4 51.351.3 36.231.734.734.2
Abbreviations: M-Math = Minerva-Math · OB = OlympiadBench · M500 = MATH-500 · GK24 = Gaokao 2024 · MMLU-R = MMLU-Redux · CPA-KQA = CPA-KQA · FEKR = FinEval-KR · XFB = XFinBench. Source: Table synthetic_data_mgf_llama in the paper. Bold marks the best in each column.
Table D. Llama-3.1-8B — Law, Medical, and Science
Generator Law Medical Science
LegalBench LexGLUE Avg MedCaseR. MedMCQA MedR-Bench Avg MMLU-STEM MMLU-Pro GPQA SuperGPQA ChemBench PIQA SciBench Avg
No synthetic training 87.951.169.5 9.917.134.320.4 25.314.714.18.214.711.43.813.2
DataFlow-based Generators
DataFlow84.061.372.712.321.356.129.98.53.75.12.56.16.40.34.7
DataFlow-Skill85.261.073.112.433.861.836.05.61.73.31.74.64.80.03.1
LLM-based Generators
Claude Opus 4.685.956.171.016.327.264.836.117.110.410.86.19.29.62.29.3
Gemini 3.0 Pro86.161.974.016.416.367.633.416.710.39.86.110.29.21.69.1
GPT-5.291.661.376.413.526.956.832.414.77.410.74.99.011.90.68.5
Agent-based Generators
Qwen3.5-Plus84.262.373.216.713.769.933.417.39.511.15.112.18.90.99.3
GLM-4.783.860.772.215.620.067.134.216.99.99.15.412.08.40.68.9
Claude Opus 4.687.452.169.814.818.464.832.717.09.410.75.710.97.81.99.1
Gemini 3.0 Pro86.360.673.516.515.970.234.210.13.85.02.35.911.00.35.5
GPT-5.284.561.372.916.821.360.132.78.13.32.92.24.49.10.24.3
GPT-5.3-codex89.663.176.318.323.765.035.716.49.010.45.38.57.70.68.3
Skill (Claude Opus 4.6) 86.653.770.2 13.727.964.635.4 16.28.59.14.87.55.90.27.5
Abbreviations: MCR = MedCaseReasoning · MMCQA = MedMCQA · MRB = MedR-Bench · MSTEM = MMLU-STEM · MPRO = MMLU-Pro · SGPQA = SuperGPQA · CB = ChemBench · SB = SciBench. Source: Table synthetic_data_slm_llama in the paper.

07Track 2 · Data Quality Evaluation Results

Track 2 asks whether a data-quality metric can rank candidate datasets before paying the cost of fine-tuning. For each candidate, we compute a metric score, then compare those scores with the empirical downstream performance of models actually fine-tuned on the same candidates. A reliable metric should produce correlations with the expected sign, across domains and across base models.

How to read the correlation tables
  • DAS is reported through its MMD distance. Smaller MMD means better alignment, so a strong negative MMD-performance correlation corresponds to a strong positive DAS-performance correlation.
  • Underline marks reliability. Underlined cells are statistically significant and point in the theoretically expected direction.
  • Avg columns matter most. They summarize whether a metric remains useful across Qwen2.5-7B, Llama-3.1-8B, and Mistral-7B-v0.3.
  • The main result: Among the tested metrics, DAS has the strongest or tied strongest domain-average correlation in General, Math, Science, and Medical, while Finance and Law favor different non-DAS metrics.
negative correlation positive correlation underline = significant & theoretically consistent (p < 0.05)
Table E. General · Math · Science — full Pearson correlations & runtime
Metric Time (s) General Math Science
QwenLlamaMistralAvg QwenLlamaMistralAvg QwenLlamaMistralAvg
Distribution-based
MMD (DAS = −MMD) 306.02 −0.64−0.65−0.74−0.68 −0.72−0.93−0.94−0.86 −0.53−0.82−0.80−0.72
Quality-based
Qurating-WritingStyle84.65 0.170.360.380.30 −0.48−0.33−0.46−0.42 −0.10−0.160.04−0.07
Qurating-Expertise −0.17−0.37−0.42−0.32 0.610.760.710.69 0.560.760.830.72
Qurating-FactsTrivia 0.030.100.020.05 −0.35−0.04−0.20−0.20 −0.080.140.320.13
Qurating-Educational −0.030.170.130.09 −0.230.04−0.10−0.10 0.010.170.340.18
BERTVendi459.37 0.380.470.580.47 −0.69−0.40−0.54−0.54 −0.41−0.10−0.07−0.19
SimCSEVendi 0.300.460.550.44 −0.80−0.50−0.63−0.65 −0.66−0.43−0.34−0.48
Deita-Quality434.99 0.060.460.180.23 −0.42−0.46−0.54−0.47 0.08−0.26−0.13−0.10
RewardModel109.61 0.560.670.540.59 −0.71−0.81−0.85−0.79 −0.39−0.54−0.32−0.42
Superfiltering40.05 0.130.250.300.23 −0.11−0.21−0.29−0.21 0.02−0.10−0.13−0.07
FineWebEdu11.67 −0.43−0.43−0.37−0.41 0.420.740.650.60 0.090.450.590.37
PairQual12.34 −0.03−0.03−0.15−0.07 −0.160.06−0.06−0.05 0.190.230.400.27
Perplexity40.60 0.470.430.480.46 −0.71−0.56−0.62−0.63 −0.59−0.32−0.44−0.45
Diversity-based
MTLD2.59 0.480.380.320.39 −0.58−0.59−0.67−0.62 −0.48−0.67−0.49−0.55
HD-D 0.17−0.080.020.03 −0.34−0.17−0.25−0.25 −0.64−0.61−0.44−0.56
Task2Vec7.93 −0.040.160.170.10 −0.48−0.09−0.25−0.27 −0.65−0.36−0.21−0.41
Ngram1.06 −0.01−0.050.00−0.02 −0.310.12−0.05−0.08 −0.220.040.220.01
Deita-Complexity344.34 0.520.250.260.34 −0.19−0.34−0.32−0.28 0.050.270.320.22
Source: Table eval_results_gms in the paper. The MMD row is the distance form of DAS, so negative correlations indicate that higher DAS predicts better downstream performance. MMD/DAS is strongest in General (\(-0.68\)) and Math (\(-0.86\)); in Science, it is close to QuRating-Expertise and remains strong across two of three base models.
Table F. Medical · Finance · Law — full Pearson correlations
Metric Medical Finance Law
QwenLlamaMistralAvg QwenLlamaMistralAvg QwenLlamaMistralAvg
Distribution-based
MMD (DAS = −MMD) −0.73−0.87−0.72−0.77 0.18−0.57−0.14−0.18 0.500.170.400.36
Quality-based
Qurating-WritingStyle −0.100.20−0.060.01 0.030.130.330.16 0.63−0.080.640.40
Qurating-Expertise 0.560.730.660.65 −0.040.130.600.23 0.72−0.370.370.24
Qurating-FactsTrivia 0.310.660.360.44 −0.060.230.470.21 0.58−0.150.700.37
Qurating-Educational 0.050.400.140.20 −0.050.100.490.18 0.57−0.270.640.31
Deita-Quality 0.570.630.680.63 −0.18−0.450.15−0.16 0.46−0.590.240.04
RewardModel 0.260.320.230.27 −0.07−0.30−0.06−0.14 0.43−0.080.510.28
Superfiltering −0.29−0.22−0.43−0.31 0.710.600.690.67 0.520.520.410.48
FineWebEdu 0.180.550.290.34 −0.230.160.480.13 0.57−0.220.590.31
PairQual 0.440.710.530.56 −0.100.090.390.13 0.63−0.280.610.32
Perplexity −0.53−0.30−0.64−0.49 0.560.590.350.50 0.060.330.530.31
BERTVendi −0.64−0.26−0.56−0.49 0.330.790.230.45 0.420.200.440.35
SimCSEVendi −0.47−0.09−0.50−0.35 0.130.540.160.28 0.280.150.740.39
Diversity-based
Task2Vec 0.060.39−0.030.14 −0.260.200.290.08 0.12−0.120.910.30
MTLD 0.270.480.230.33 0.170.470.370.34 0.710.260.590.52
HD-D 0.200.550.160.30 0.150.480.400.34 0.450.030.840.44
Ngram 0.120.540.180.28 −0.020.500.420.30 0.54−0.010.660.40
Deita-Complexity −0.10−0.02−0.09−0.07 0.570.060.440.36 0.550.010.250.27
Source: Table eval_results_mfl in the paper. MMD/DAS is strongest in Medical (\(-0.77\)). In Finance, Superfiltering is strongest (\(+0.67\)); in Law, MTLD is strongest (\(+0.52\)). No single metric is reliable across every domain.
DAS Pearson correlation with downstream performance, per domain
Math
+0.86
Medical
+0.77
Science
+0.72
General Text
+0.68
Law
−0.36
Finance
+0.18
Bar magnitude is \(|\rho|\); the displayed value is DAS's Pearson correlation with downstream performance, averaged across Qwen2.5-7B, Llama-3.1-8B, and Mistral-7B-v0.3 (computed as the sign-flipped MMD correlations reported in Tables E & F, since DAS \(=\) \(-\)MMD). Longer bars in Math, Medical, Science, General indicate that DAS is a strong consistent predictor; Finance is weak; in Law the direction flips.

08Key Findings

More synthetic data is not automatically better

Adding domain-specific synthesized data on top of Dolly-15k frequently reduces downstream performance. Since the protocol changes only the added domain data, these regressions show why data construction must be evaluated end to end.

No construction family wins everywhere

DataFlow-style workflows do well in structured settings such as Law and Finance, while agent-based methods are often competitive or strongest in reasoning-heavy domains. Direct LLM prompting is a useful simple baseline, but its results vary substantially across domains.

Skill-guided construction is strong but selective

Data-Construction-Skill is competitive in knowledge-extraction settings, tying for best on Qwen General and lifting Llama Finance from 15.1 to 34.2. Its weaker Science results suggest room for future skills that better handle open-ended scientific reasoning.

DAS is the most consistent overall quality signal

DAS strongly tracks downstream utility in Math (+0.86), Medical (+0.77), Science (+0.72), and General Text (+0.68), making distributional alignment the most consistent overall signal among the tested metric families.

Existing metrics are narrow or sign-inconsistent

Quality and diversity metrics often work in one domain but weaken or flip sign in another. Finance and Law favor different non-DAS metrics, with Superfiltering strongest in Finance and MTLD strongest in Law, so no metric is uniformly reliable.

DataPrep-Bench makes comparison reproducible

By fixing raw corpora, candidate pools, base models, training recipes, and downstream benchmarks, the benchmark turns data preparation from anecdotal comparison into a measurable testbed for agents, workflows, skills, and metrics.